- Published on
MAE, MSE and RMSE as performance measures for regression models
Table of Contents
Introduction
There are a host of performance measures to predict how well a given model is performing such as MAE (mean absolute error), MSE (mean squared error), RMSE (root mean squared error). Each has its own advantages and disadvantages.
In this article, we will look at all three and see the advantages and disadvantages of each.
MAE (Mean Absolute Error)
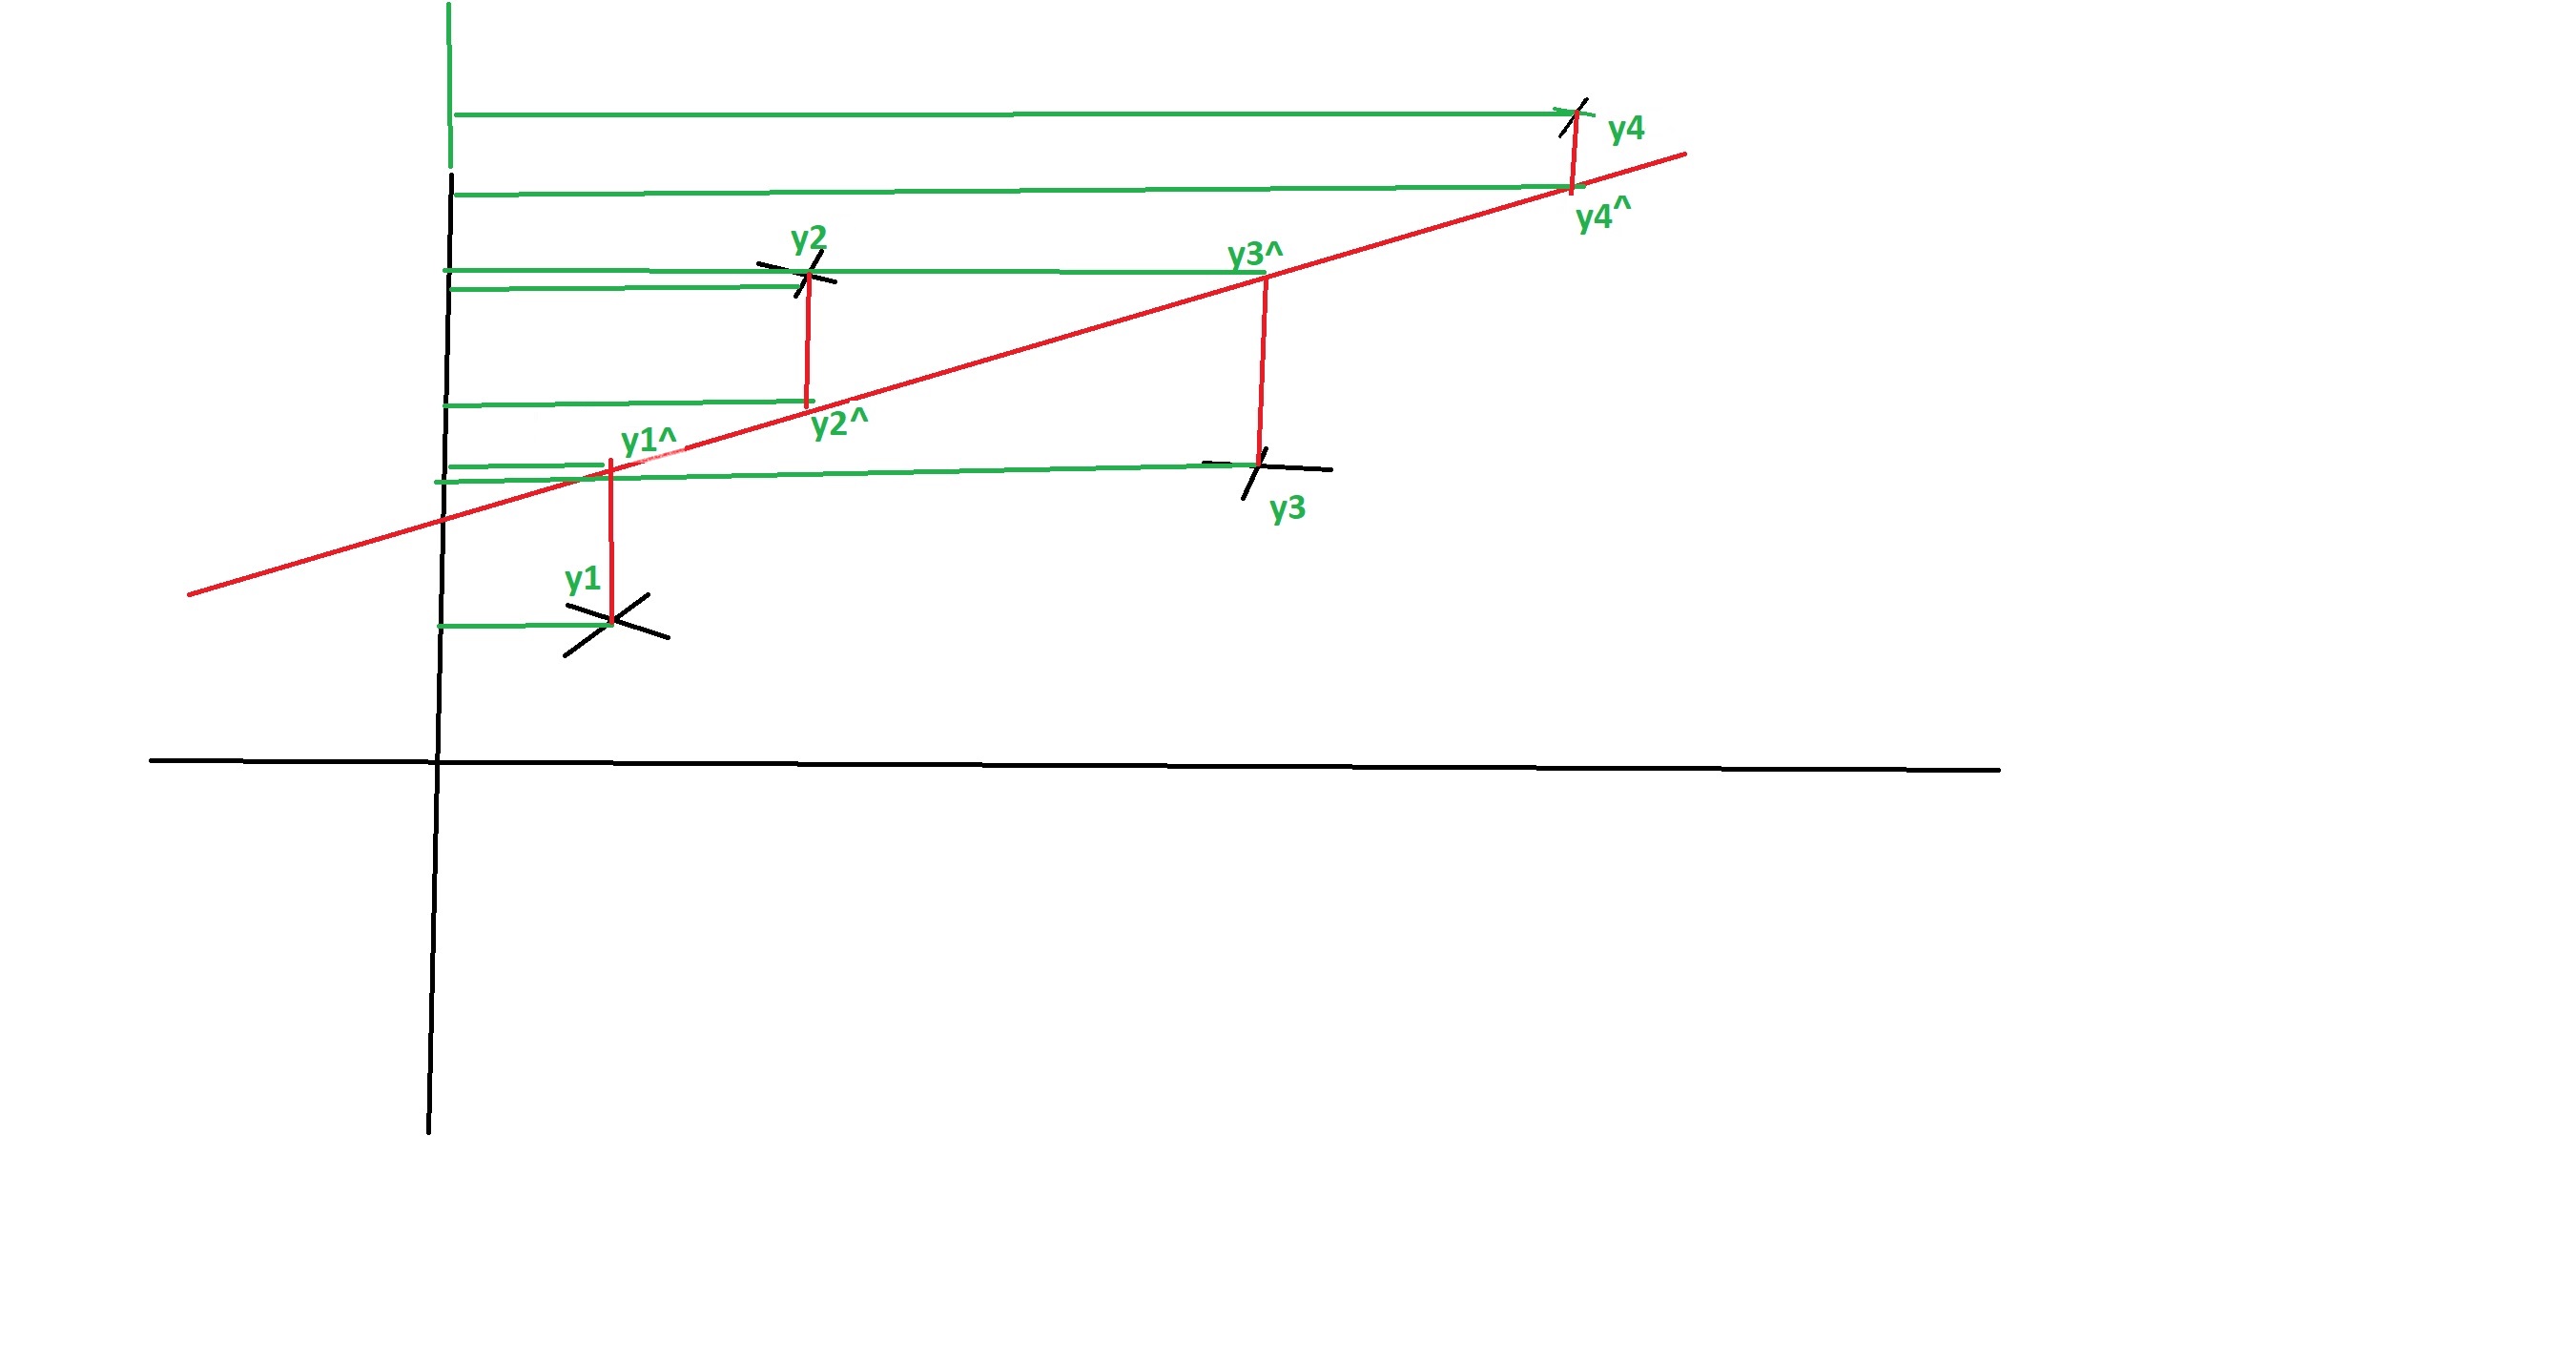
The values of , , , that lie along the regression line are what we want but instead our model is outputting , , , .
The whole exercise here is to construct a model such that we get these values of , , , , to be as close to their corresponding , , , , as possible. The closer we get, the better our model is.
MAE, MSE and RMSE are all loss functions. The lower the value of the loss function, the better our model is.
In the case of MAE we simply sum the absolute error between what the actual value is for a given point and what our prediction is & then divide by the number of occurences, so, say we look at the first occurence and want to know what the error is for that one point, we get and then take its absolute value as and then we do the same for all the other points and then sum them up as and divide by the number of points to get the mean error as which can also be written as
Now, that we understand how to calculate MAE, question arises why do we have other metrics such as MSE and RMSE? Why not just use MAE? Well, in certain sets of data, certain metrics perform well while in others they don't. Let's talk aout its advantages and disadvantages. The first advantages is its simplicity. It's very easy to understand and calculate. The number you get which is the MAE is in the same units as so, if is in dollars, then MAE will also be in dollars. The second advantage is that it is very robust with outliers. So, if you have a few outliers in your data, MAE will not skew the final number all that much unlike MSE which we'll see next, where this measure is not all that robust with outliers.
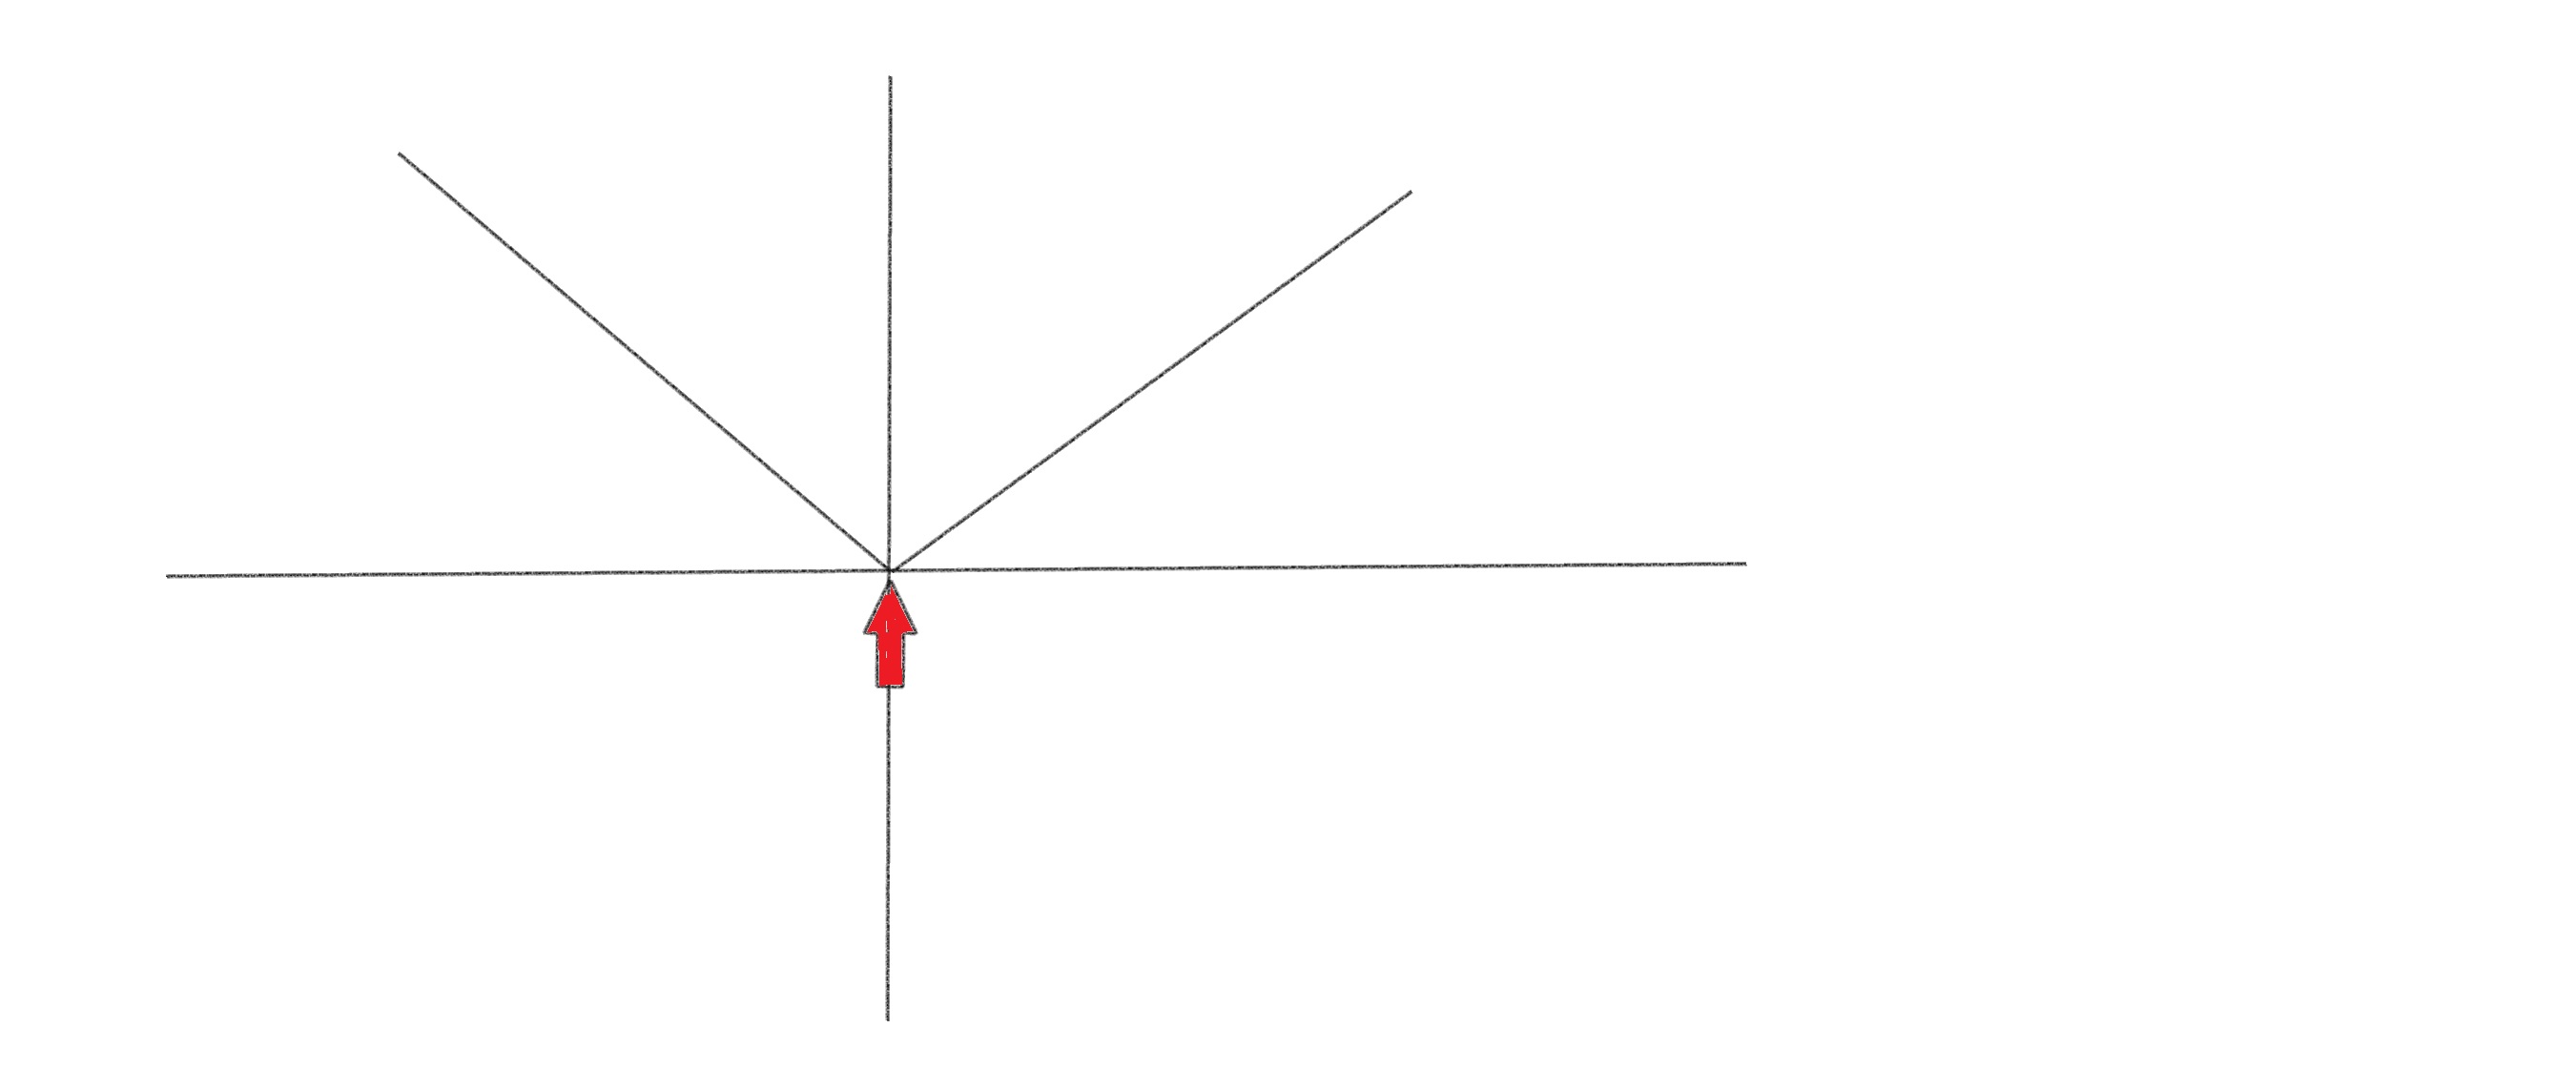
The biggest drawback is that the modulas function is not differentiable at 0, or to put it another way, the derivative changes abruptly at 0 as shown in the figure below.
Enter MSE, which we'll talk about next.
MSE (Mean Squared Error)
With MSE, there is a subtle change from MAE where if we look at MAE again, we have and now all that we do is square the error term to get .
So, essentially, we just replace the modulas function with a square function.
Nice thing about MSE is that it is differentiable at all points as shown in the figure below. 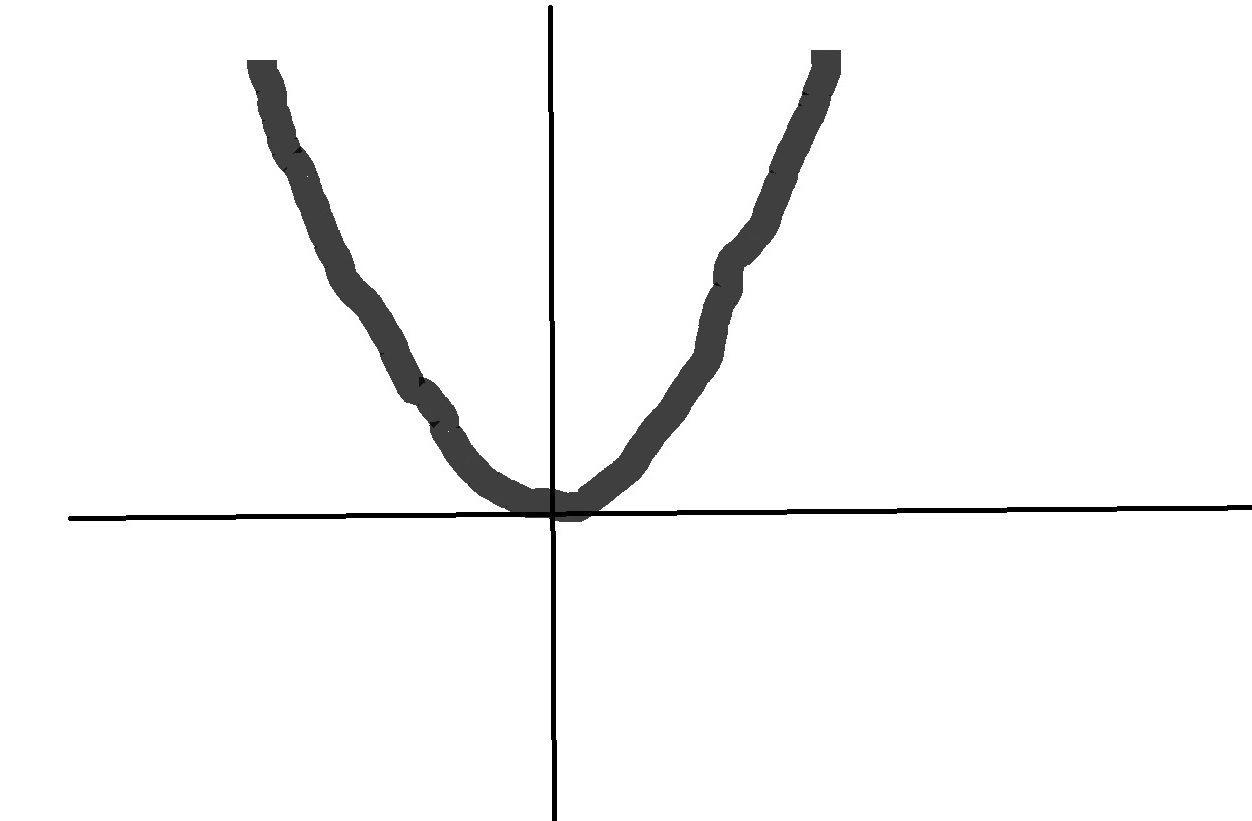
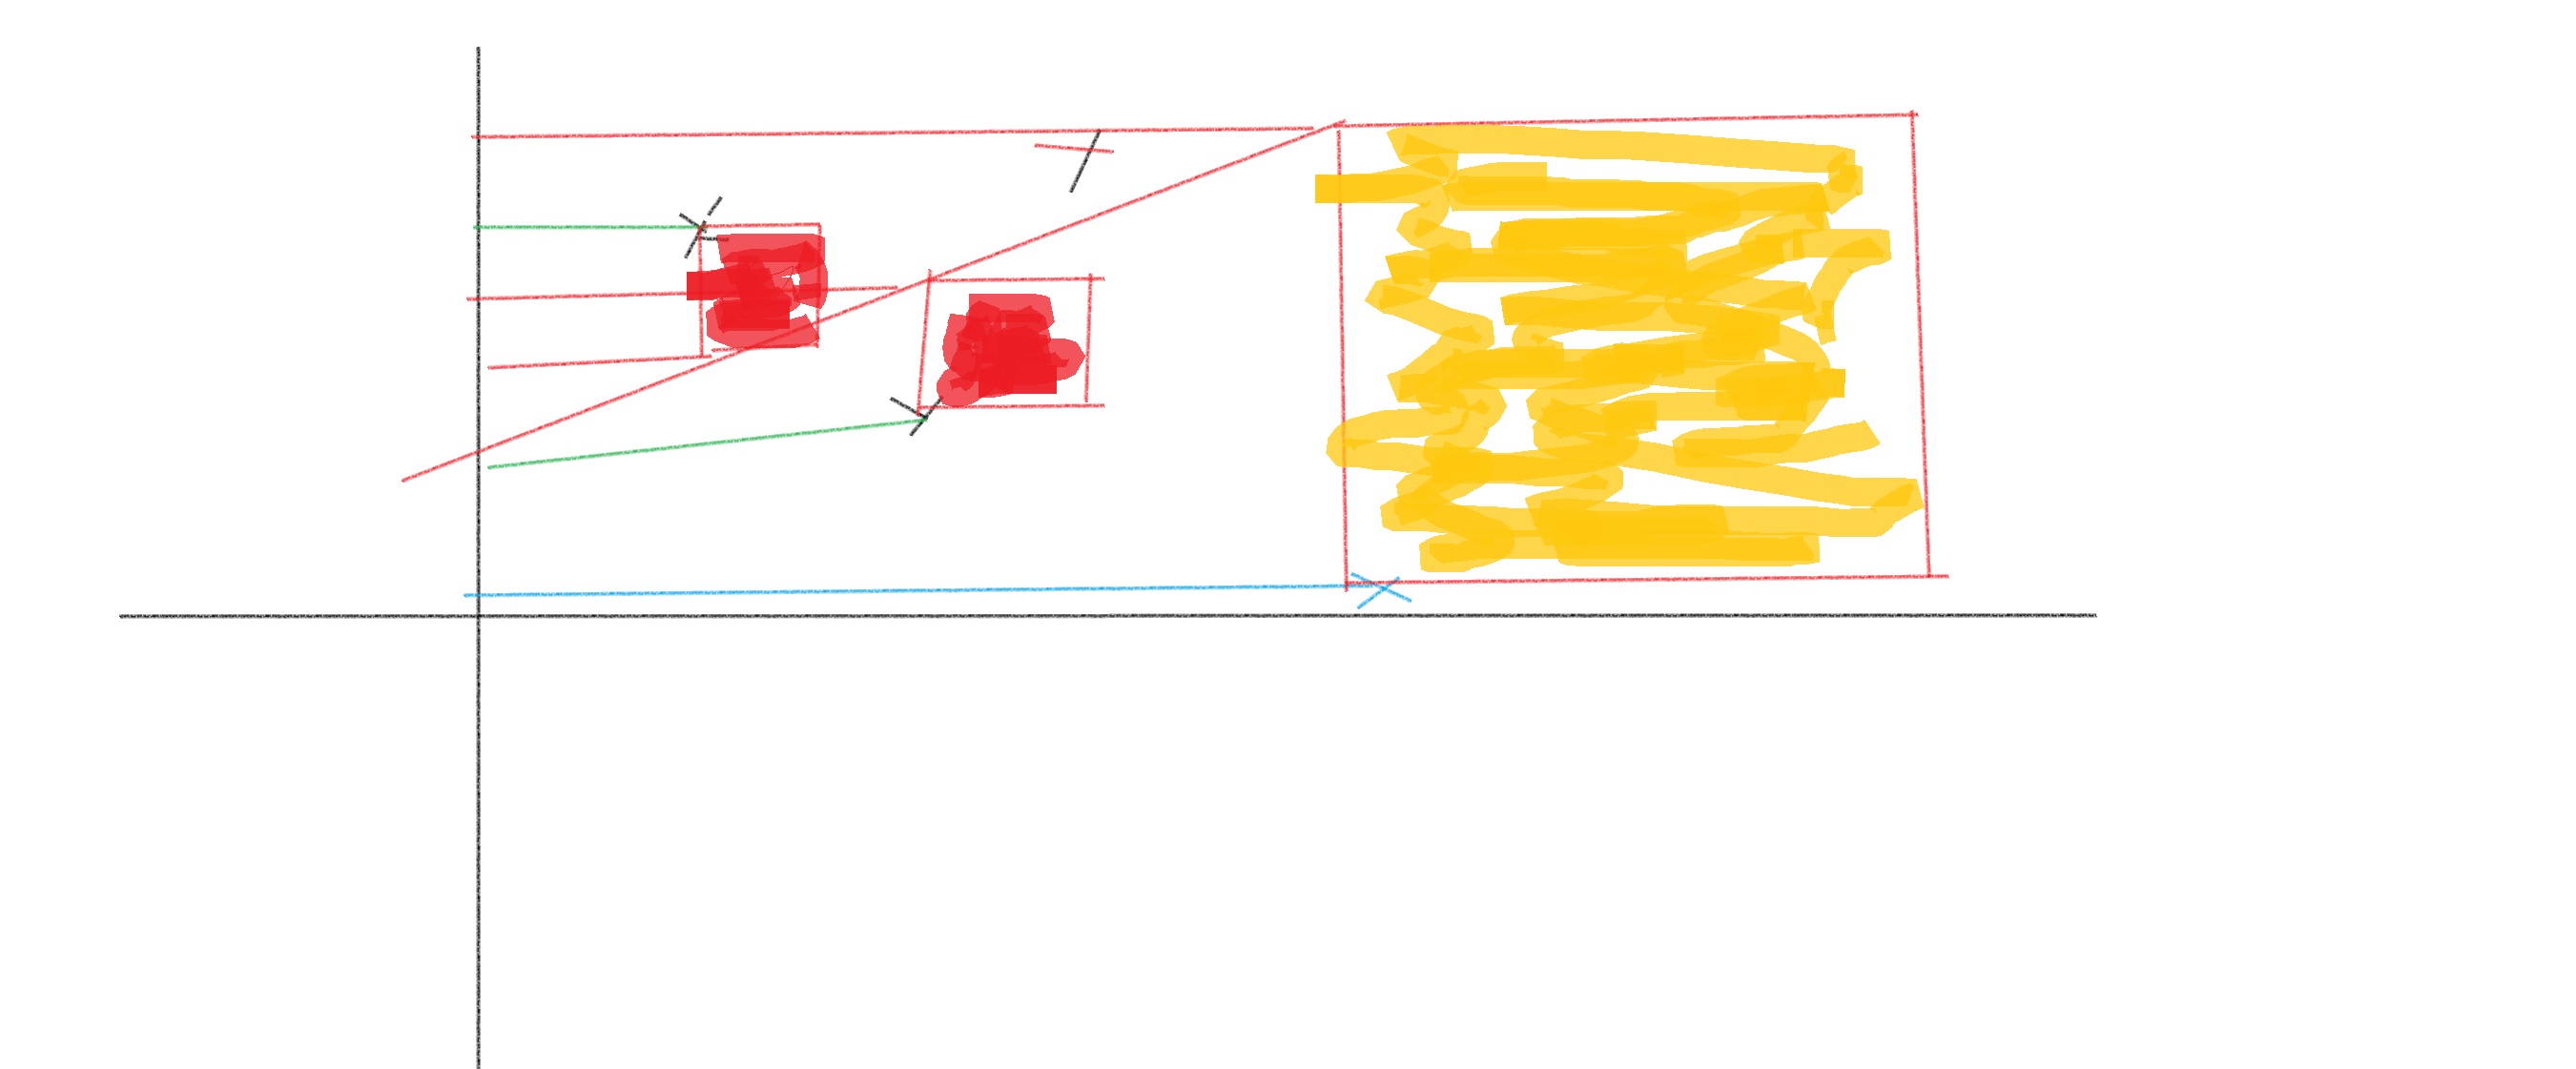
Geometically, if we want to represent then we get the following
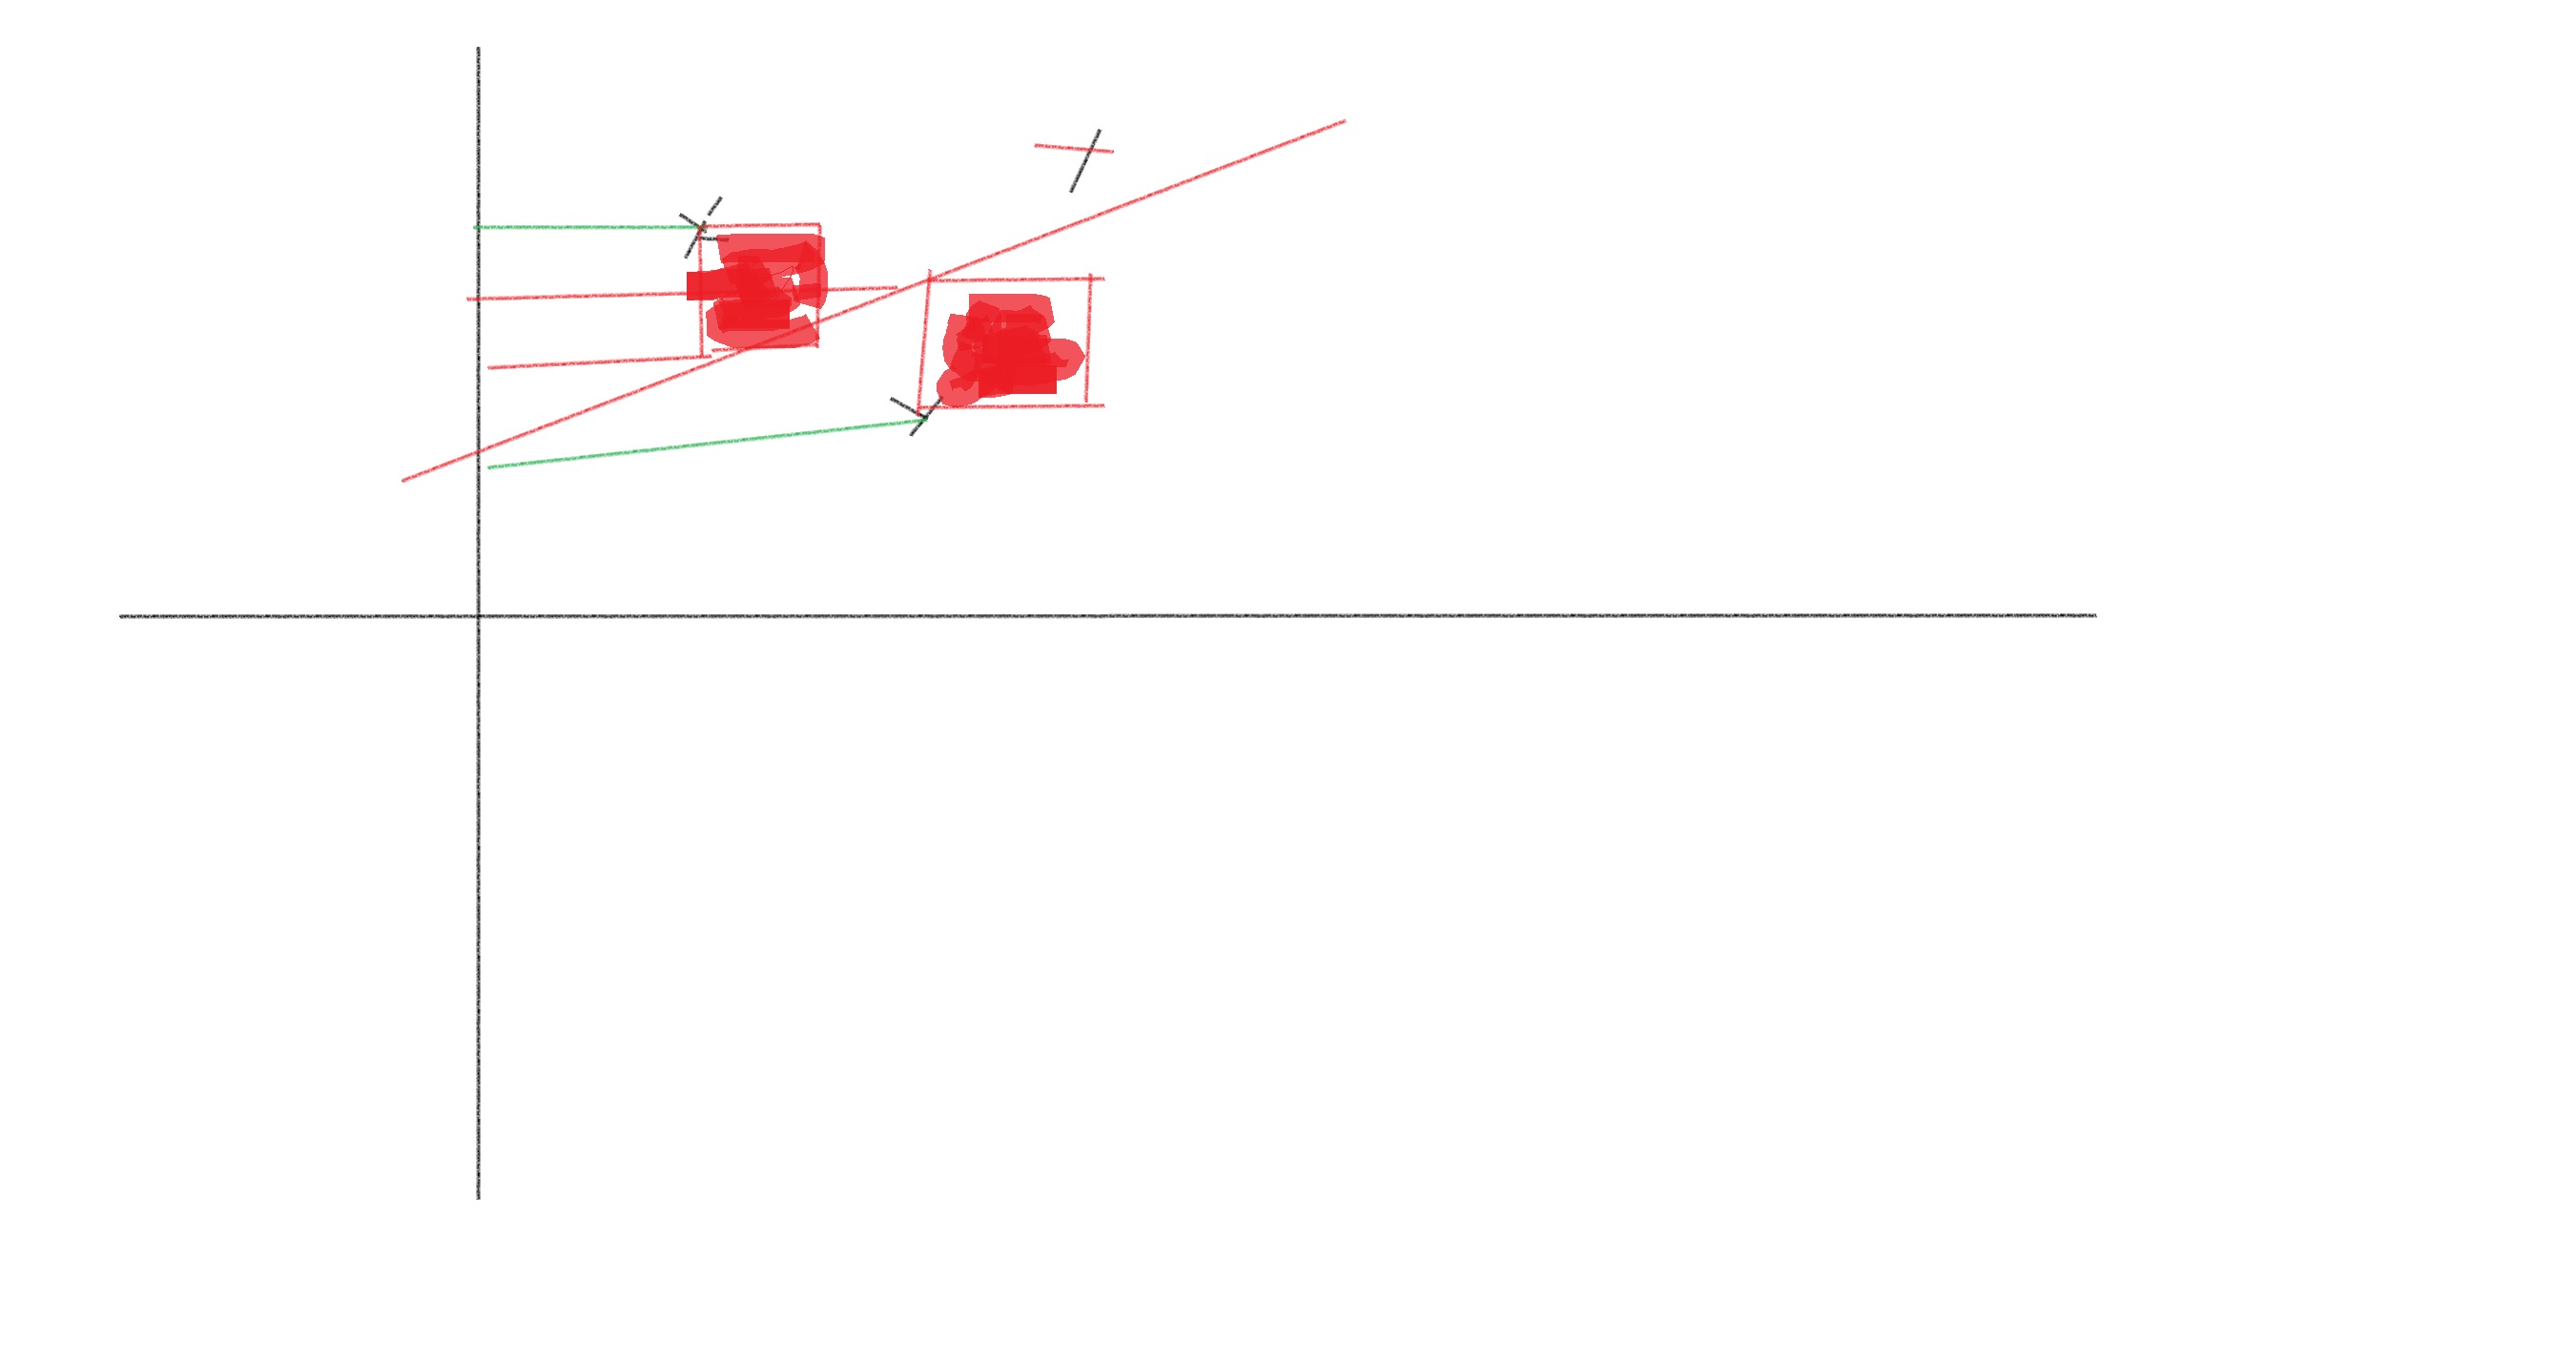
The first square represents the error term and the second square represents the error term
So, MSE is simply adding the squares as you see in the figure above and then dividing by the number of points to get the mean error as .
Biggest advantage is that it can be used as a loss function since it is differentiable at all points.
The disadvantage is that the final number is a squared number so a bit difficult to interpret. So, say the loss is 1000, then you need to take its square root which then would be which is 31.6.
But, the biggest disadvantage is that it is not forgiving to outliers. So, see the last square shaded in gold below and that square is disproportionately contributing to the final loss number. Hence, it isn't robust to outliers.
RMSE (Root Mean Squared Error)
RMSE is nothing but
or
RMSE =
It has all the advantages of MSE where it is differentiable at all points and the loss function is in the same units as . On the flip side, this like MSE is not robust to outliers.
Conclusion
It's best to use all three metrics, at least initially, and see which one performs best for your data. Since these are all loss functions, you'll want to reduce the final value as much as possible. Often when you try to optimize for one metric, you'll see that the other metric(s) may suffer.